Introduction
Have you ever wondered about the Universe? How did it begin? Has it changed over time? What will happen in the future? If you have, you're not alone! For centuries scientists have been trying to answer these kinds of questions.
About one hundred years ago, astronomer Edwin Hubble measured the distance to stars in the Andromeda Galaxy using a technique pioneered by Henrietta Leavitt. Hubble was surprised to discover that the Andromeda Galaxy was much farther away than all the stars and gas clouds in our galaxy, the Milky Way. His discovery made us realize that the Universe is much larger than we previously thought!
But Hubble's second discovery was even more revealing. Here's the backstory:
Vesto Slipher had previously measured redshifts to some galaxies and discovered almost all of these galaxies appeared to be moving away from Earth at astonishing speeds. (We refer to the speeds that galaxies appear to be moving away from Earth as recessional velocities.)
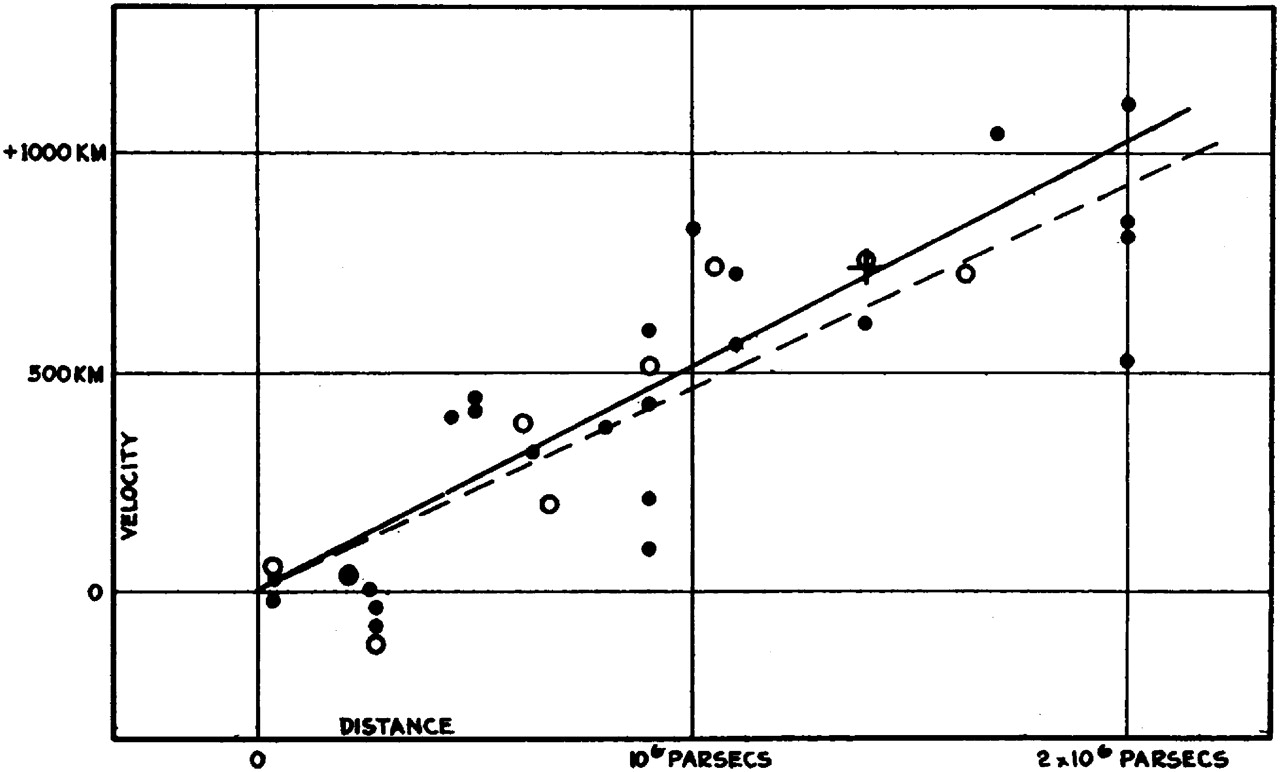
Hubble and his assistant Milton Humason began to study more galaxies using Slipher's technique to determine their speeds, and Leavitt's technique to measure galaxy distances. He then plotted the galaxy velocities vs. their distances. This type of graph is now known as a Hubble plot. At the right is the plot of Hubble's original data.
Hubble's observations provided strong evidence that the Universe is expanding, confirming the earlier theoretical models proposed by Albert Einstein and Georges Lemaitre. When Hubble first made his plot, he only had data for galaxies relatively close to Earth. We can now observe galaxies at great distances from Earth.
Vera C. Rubin Observatory will produce an unprecedented amount of new data from very dim and distant galaxies.These observations will provide a more refined Hubble plot by adding many more data points, helping us to better model the expansion of the Universe over time.
Please answer all questions before continuing to the next page.